Logo of Green Day Indicators

{ SHOP }

TRADING TOOL - GAP DOWN STATISTICS

Gap Down Stats Label for thinkorswim Study Labels in Details.

SALE!

Up to 20% off our thinkorswim custom thinkscripts.


GAP DOWN STATISTICS

Long Dark Green Bar

Price $149

SALE $129

Secured by PayPal
Long Dark Green Bar

History tends to repeat itself.


The historical behavior of a stock may help make future decisions.

The GAP DOWN STATS studies is based on the statistical analysis of daily candlestick in a yearly chart.

GAP DOWN STATS gives info on:

# of

previous

Gap Down

Avg. % Loss

on

Gap Down

Largest

Loss

Gap Dow

This Study has Adjustable Inputs:

Adjustable Icon
  • Gap Down Percentage
  • Percentage Increase of Unsual Volume
  • Decimal Places
  • Colors

Plus this study gives

Historical Analysis of How its Ends by the end of the day?

Red Candle

Ends Red and Avg. % Loss

Green Candle

Ends Green and Avg. % Gains

Furthermore, it gives a History of Washouts and/or Raiseability?

Dropability

( O > L )

History

Raiseability

( L < C )

History

Gap Down Stats Explained in Details for a Green Day  and a Red Day for $GME.

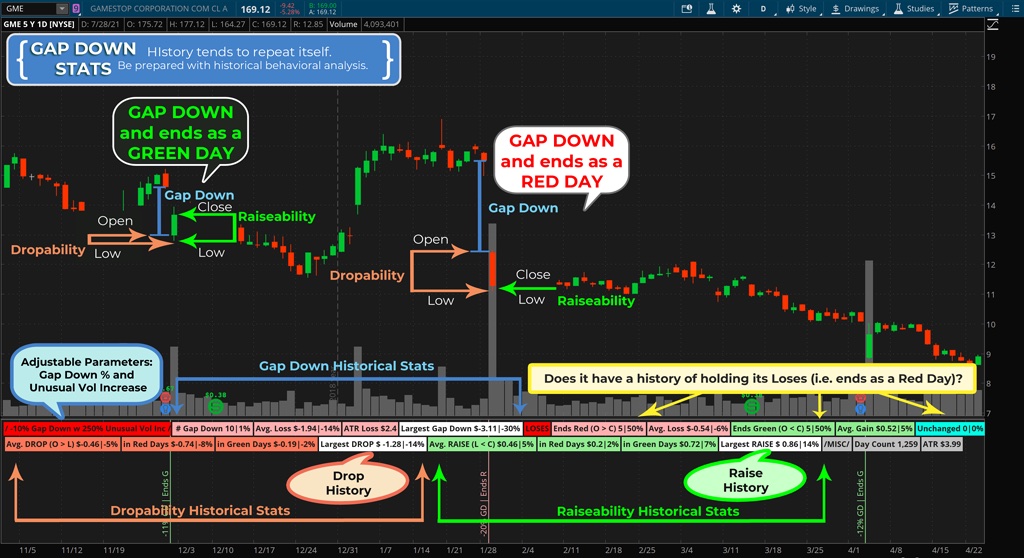
Gap Down Stats Explained in Details for a Green Day and a Red Day. 1/2

Gap Down Study of $UVAS in a Daily Candlestick Chart for thinkorswim.

Gap Down Study in a Daily Candlestick Chart. 2/2

Gap Down Stats Settings

One has the option to set how many decimal places the percentage and price data to be display with.

The Unusual Volume can be set to be calculated over a particular length and can be used to detect volume over a particular percentage.

The Gap Down Percentage can be modified to your liking -5%, -10%, -20%, -50%, etc.

The Gap Downs that have been identified can be plotted as optional vertical lines on the lower chart.

Also, the color of the labels can be changed to your liking under Globals Colors.

Gap Down Stats Study Labels for thinkorswim.

Gap Down Stats Study Labels.

Gap Down Stats Label in Details

Gap Down Stats Label for thinkorswim Study Labels in Details.

Gap Down Stats Label for thinkorswim Study Labels in Details

The first label tells you what you are looking at:

  • The specific Gap Down %.
  • And the specific Unusual Volume %.

The next few labels tell you about the GAP DOWN:

  • The number (#) of Gap Down and its the percentageoverall (i.e. How often it happens?).
  • The average loss in $ and %.
  • Average ATR loss in those Gap Down.
  • Then the Largest Gap Down in $ and %.

Then the next few are the Loses labels (How its ends/closes? or Does it holds its loses?):

  • How many days does it end up as a Red day and its percentage?
  • The average loss in $ and % on those Red days.
  • How many days does it end up a Green day and its percentage?
  • The average loss in $ and % on those Green days.
  • And if there is any unchanged days (i.e. the open isequal to the close (O = C)).

The next few labels are what I call DROPABILITY (O > L) - (How the stock behaves from open to reach its low of day!):

  • What is its average DROP gain from Open to the Low in $ and % overall?
  • And even more specifically in Red or Green days.
  • It also give the Largest DROP in $ and %.

The next few labels are what I call RAISEABILITY (L < C) - (How the stock behaves once it has reached its low of day in relation to its close!):

  • What is its average RAISE gain from the Low to Close in $ and % overall?
  • And even more specifically in Red or Green days.
  • It also give the Largest RAISE in $ and %.

Lastly the miscellaneous labels tell you:

  • the overall daily count.
  • and the usual ATR.
Gap Down Stats Explained in Details for a Green Day  and a Red Day for $GME.

Gap Down Stats Explained in Details for a Green Day and a Red Day.

Long Dark Green Bar
PayPal Acceptance Mark
Long Dark Green Bar