Logo of Green Day Indicators

{ SHOP }

TRADING TOOL - SUPPORT AND RESISTANCE LINES

Support ad Resistance Lines for thinkorswim Study Labels in Details in a Daily Candlestick Chart for $WORX.

SALE!

Up to 20% off our thinkorswim custom thinkscripts.


SUPPORT AND RESISTANCE LINES

Long Dark Green Bar

Price $99

SALE $79

Secured by PayPal
Long Dark Green Bar

History tends to repeat itself.


Previous highs and lows can be used as future Support or/and Resistance.

These Support and Resistance Lines are based on Pivot's Highs and Lows.

It can be put on any chart (Chandlestick, Heikin-Ashin, etc.) and time frame (tick, min, hr, day, week, etc.).

This Study has Adjustable and Optionnal Inputs:

Adjustable Icon
  • How often to show lines
  • Visible Lines, Prices
  • Decimal Places
  • Colors


Support and Resistance Lines of $ARLO on a 1 min Candlestick Chart for thinkorswim.

Support and Resistance Lines on a 1 min Candlestick Chart. 1/8

Support and Resistance Lines of $SNOA on a 1 min Candlestick Chart for thinkorswim.

Support and Resistance Lines Study on a 1 min Candlestick Chart. 2/8

Support and Resistance Lines of $MARA on a 5 min Candlestick Chart for thinkorswim.

Support and Resistance Lines on a 5 min Candlestick Chart. 3/8

Support and Resistance Lines of $AAPL on a 15 min Candlestick Chart for thinkorswim. 

Support and Resistance Lines of $BGFV on a Daily Candlestick Chart for thinkorswim.

Support and Resistance Lines on a 15 min Candlestick Chart. 4/8

Support and Resistance Lines of $AAPL on a 15 min Heikin Ashi Chart for thinkorswim.

Support and Resistance Lines of $AAPL on a 15 min Heikin Ashi Chart. 5/8

Support and Resistance Lines of $BGFV on a Daily Candlestick Chart for thinkorswim.

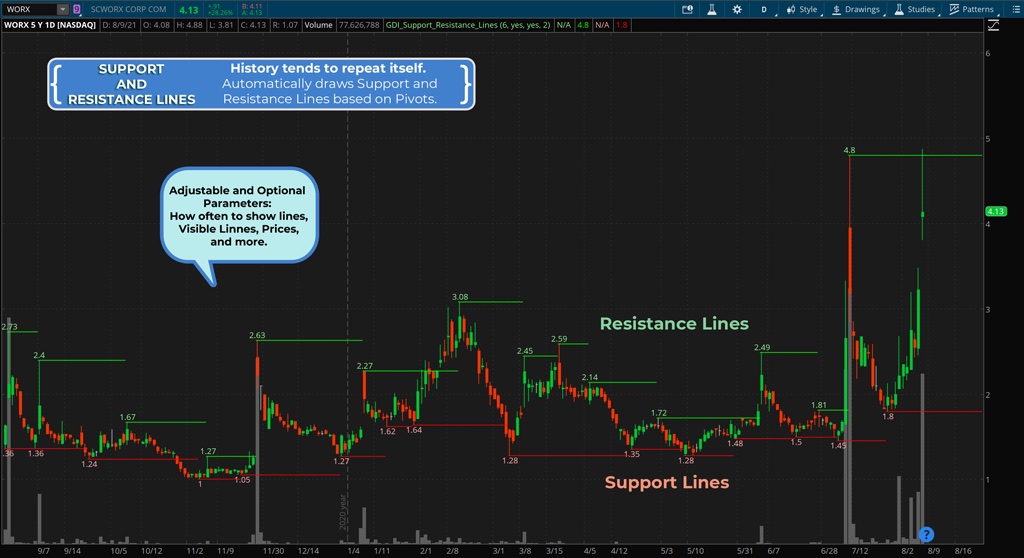
Support and Resistance Lines on a Daily Candlestick Chart. 6/8

Support and Resistance Lines of $USX on a Daily Candlestick Chart for thinkorswim.

Support and Resistance Lines on a Daily Candlestick Chart. 7/8

Support and Resistance Lines of $SGRP on a Weekly Candlestick Chart for thinkorswim.

Support and Resistance Lines on a Weekly Candlestick Chart. 8/8

Support and Resistance Lines Settings

The n value gives you the opportunity to control how often the Support and Resistance Lines are drawn.

  • The bigger the n value the less lines drawn, while the smaller the n value the more lines drawn.

The Show Lines and Show Price are set up as optional.

Additionally, one has the option to set how many decimal places the price data to be display with.

Also, the color of the Price on the lines and Line of the Support and Resistance can be changed to your liking.

Support and Resistance Lines thinkorswim Study Settings.

Support and Resistance Lines Study Settings.

Long Dark Green Bar
PayPal Acceptance Mark
Long Dark Green Bar